2022.05.03 22:49:12 (1521592733361598464) from Daniel J. Bernstein:
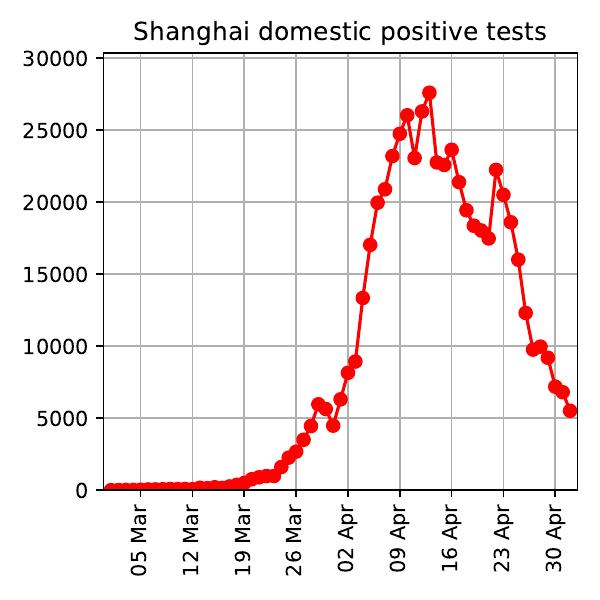
Now open-sourced updated software to parse the NHC announcements: https://cr.yp.to/software/nhcparse-20220503.tar.gz This extracts + graphs important data that's missing from the @JHUSystems database (and thus Google's case graphs), notably the total per-region (e.g. Shanghai) cases including asymptomatic. https://twitter.com/hashbreaker/status/1520836496609071104
2022.05.03 22:57:58 (1521594940257542146) from Daniel J. Bernstein:
Improvement vs. graph I posted earlier: parsing now extracts and subtracts the cases-converted-from-asymptomatic-to-symptomatic from the total symptomatic+asymptomatic. (Conversions aren't new cases. ~40% of news articles get this wrong.) This noticeably changes Shanghai graphs.
2022.04.09 20:46:58 (1512864666413723649) from Daniel J. Bernstein:
I understand the reports of big costs (economic, psychological, human, et al.) of China's anti-COVID actions in Shanghai, but I'm puzzled to see confident declarations that the actions are ineffective. Why is it clear that daily cases won't be much lower by the end of this month?
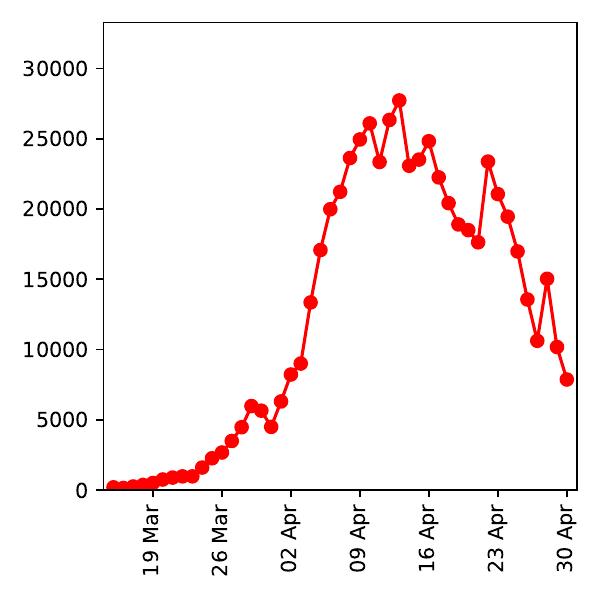
2022.05.01 20:44:11 (1520836496609071104) from Daniel J. Bernstein:
Plotted the Shanghai case numbers (total symptomatic+asymptomatic) extracted from http://www.nhc.gov.cn/yjb/pzhgli/new_list.shtml. Found it somewhat annoying to automate this extraction: Chinese is ok, frivolous JS is ok, but kept getting 412 (even with pyppeteer), plus had to parse semi-free-form text. https://twitter.com/hashbreaker/status/1512864666413723649